MSI applications part 4: drugs and small molecule metabolites
In this blog post we look at the use of mass spectrometry imaging for investigating small molecules such as drugs and metabolites and then a quick overview of different metabolomic MSI studies and some challenges facing this area but also tools that can help you with your drug metabolite study.
This post is part of our series titled "Introduction to mass spectrometry imaging", which contains the following entries:
- MSI hardware part 1: ionization techniques
- MSI hardware part 2: mass analyzers
- MSI applications part 1: glycans
- MSI applications part 2: peptides and proteins
- MSI applications part 3: lipids
- MSI applications part 4: drugs and small molecule metabolites (current post)
Table of contents
Introduction
If you’ve been following this blog for a while (and I really hope you have been), it should be clear by now that mass spectrometry imaging (MSI) can be used to visualize many different compounds simultaneously without the use of labels. It should also be apparent that MSI is particularly useful for compounds for which traditional techniques are not specific enough or are not capable of imaging the molecular class of interest. Anyway, we can also throw small molecules such as drugs and endogenous metabolites into this latter basket.
Introducing Metabolomics – time to figure out what’s really going on inside!
If you’ve been following this blog for a while (and I really hope you have been), it should be clear by now that mass spectrometry imaging (MSI) can be used to visualize many different compounds simultaneously without the use of labels. It should also be apparent that MSI is particularly useful for compounds for which traditional techniques are not specific enough or are not capable of imaging the molecular class of interest. Anyway, we can also throw small molecules such as drugs and endogenous metabolites into this latter basket.
Metabolomics is the study of small molecules of a biological system within cells, biofluids, tissues or organisms 1. Small molecules are compounds with a molecular weight typically between 50 – 1,500 Da which are involved in biological processes as substrates, products and intermediates of metabolic pathways 2. They can be from a variety of different molecular classes such as amino acids, lipids, sugars or drugs. The content and ratio of small molecules within a given system reflect the biochemical processes that are occurring in that system, and ultimately show the interaction between environment, gene expression, and protein function in biological and pathological states. I hope that statement makes it clear why metabolomics is an important field, but just in case you wanted some further confirmation, Figure 1 is the KEGG map showing a global overview of different metabolic pathways.
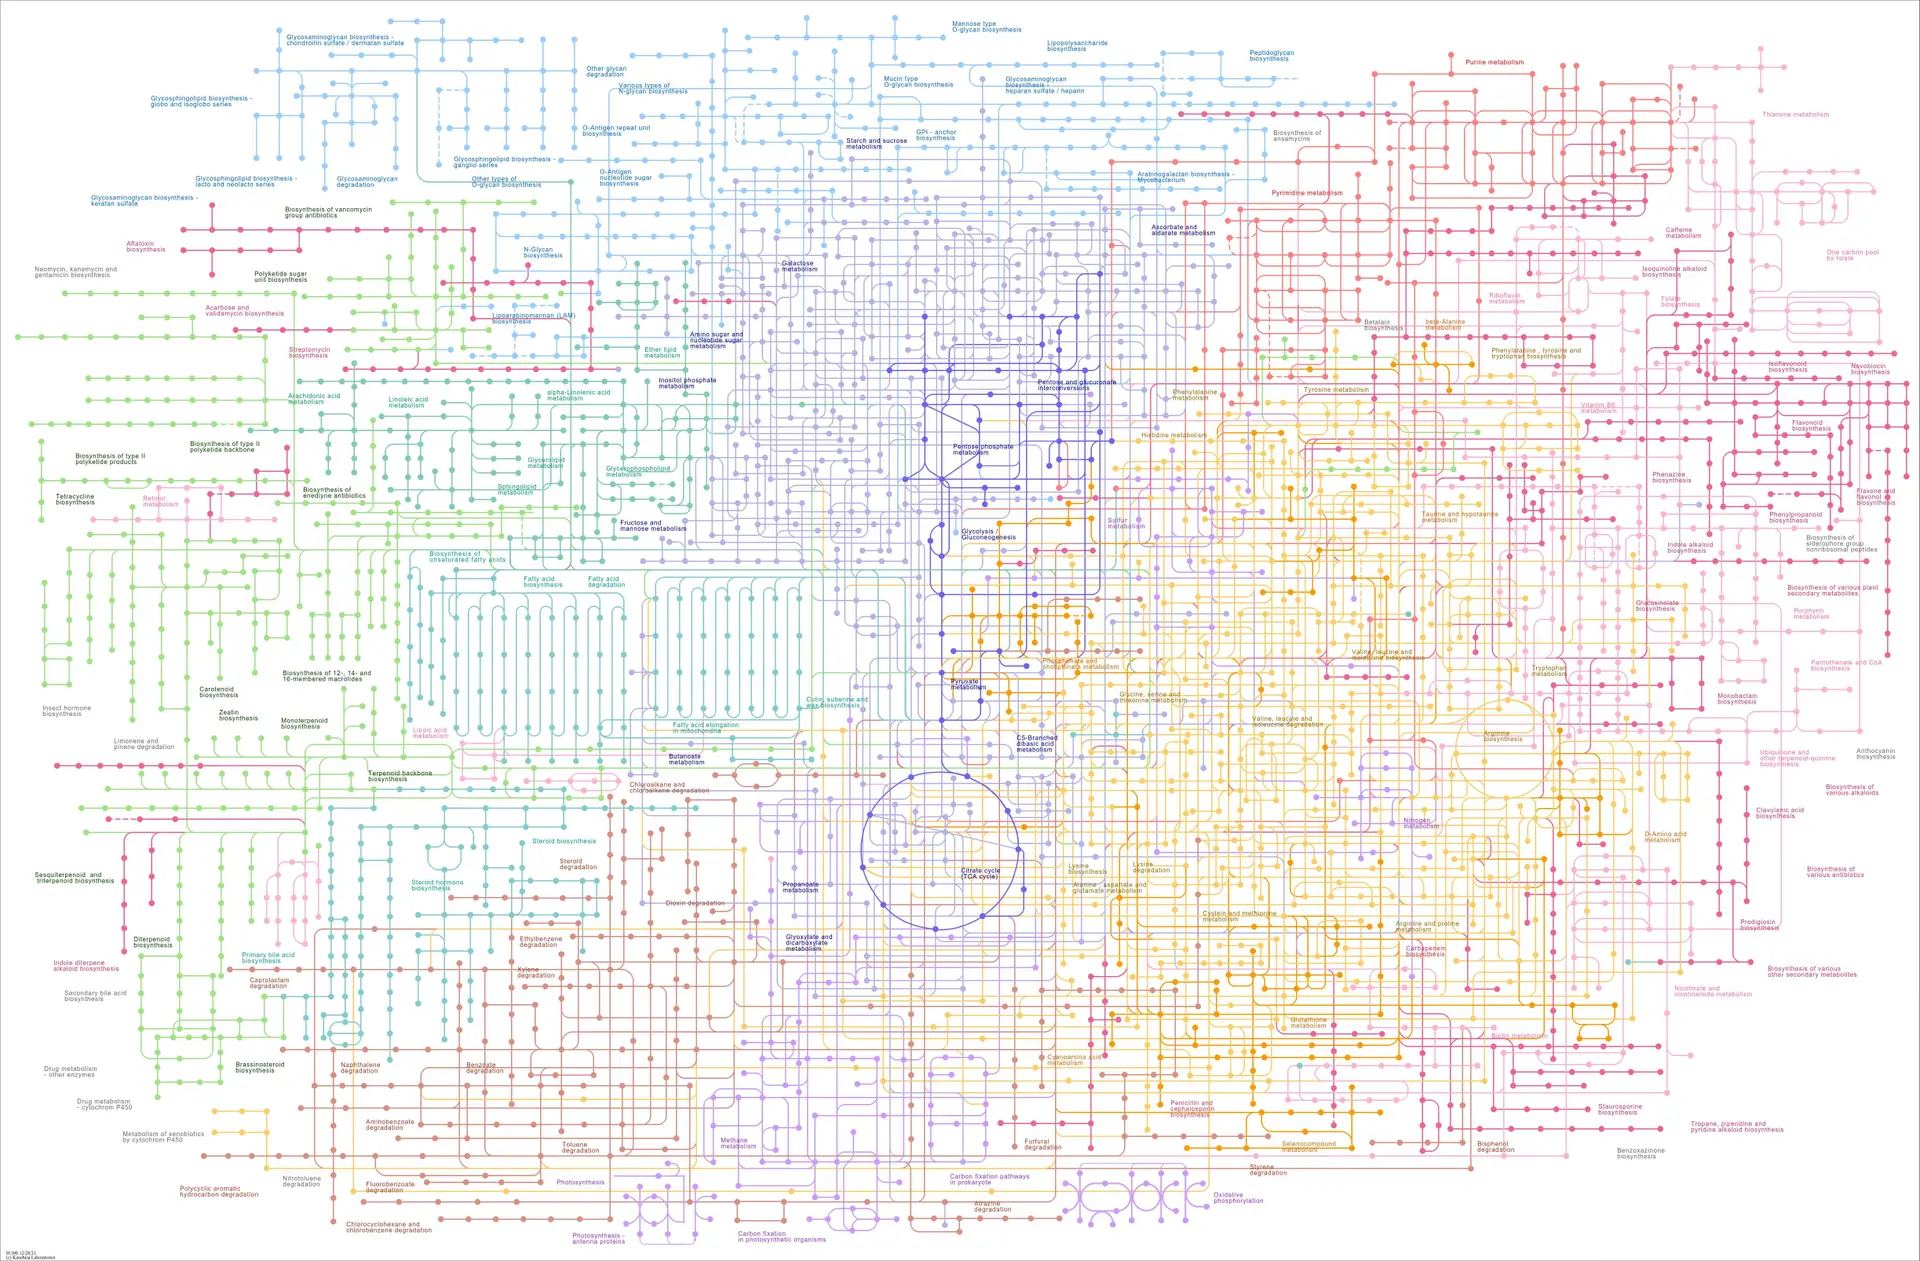
The sheer complexity of the different pathways and their interactions can be very easily seen in this figure, so now imagine you are developing a drug – you would want to know which pathways are affected by the drug and any of the drug’s metabolites to know the direct action and any downstream effects.
It goes without saying then that insight into the distribution of metabolites on both a localized and systemic manner is important. LC-MS measurements of tissue homogenates can indicate the global concentration of a drug, enzymatic byproduct, amino acid etc, but this can provide an incomplete picture as tissues are not uniform and homogenization results in the loss of spatial information. These can give ambiguous or misleading results as gradients in the distribution of drugs, drug metabolites and endogenous metabolites can be found in tissues 3,4. Other commonly used metabolomics techniques can be used to acquire spatial information, e.g. NMR 5, however MSI is by far the method of choice for spatial metabolomics studies due to the speed of measurement, wide range of analytes detected, and relatively low cost per experiment. While radio-labelled drugs and PET imaging can allow the visualization of drugs, the label can also be found in the drug’s metabolites, complicating interpretation of the drug’s distribution profile 6. In comparison, MSI can provide data on not just the distribution of drugs and drug metabolites in tissues, but also be used to demonstrate potential changes in other, endogenous metabolites after drug treatment 7,8,9.
Instrumentation for Metabolomic and Drug Measurement
Due to the low molecular weight of the compounds involved, the mass-resolving capabilities of instruments is very important in metabolomics studies, with the higher the better. Of the commonly used mass analyzers used in MSI, the mass resolution generally increases from TOF to Orbitrap to FTICR. The high resolving power and mass accuracy of FTICR and Orbitrap instruments enable better separation of molecules – not just for analyte ions but also matrix in MALDI experiments 10. For example, a 2016 study comparing the measurement of endogenous metabolites from serial FFPE sections using MALDI-FTICR and MALDI-TOF in reflector mode found that approximately one third of the peaks detected by FTICR could not be resolved by TOF, which limited peak assignment and tissue classification 11. That’s not to say that small molecule and metabolomics MSI measurements should not be conducted using TOF instruments – the same study showed it was possible to detect biomarkers previously found in FTICR analysis 11, other studies worked on a non-specific level 12,13,14, while a the fast acquisition speeds of a MALDI-TOF instrument allowed for detection of 2-hydroxyglutarate in brain tumor tissue in a five minute workflow 15.
On that note, MALDI is most commonly used MSI ionization method as it can provide high spatial resolution analysis at high acquisition speeds. The sample preservation and preparation for metabolite and drug and metabolite studies using MSI is similar to that for lipids in that the samples used are typically quick-frozen tissues are used to minimize molecular and morphological degradation, although it is possible to measure metabolite and drug signals from FFPE tissues 12, 16, 17. Likewise, matrices used for lipid imaging such as DHAP and 9AA can be used for imaging some drugs and endogenous metabolites, but matrix optimization or on-tissue chemical derivatization may be required to increase sensitivity or target specific molecules 13, 18,19. In contrast, DESI imaging requires minimal sample preparation and can detect similar molecules to MALDI, but at lower spatial resolution. In this respect, DESI and MALDI have been proposed as complementary techniques that can be used for cross-validation of results in drug research 6. For studies requiring highest spatial resolution, the use of an ion beam allows TOF-SIMS to measure at a subcellular spatial resolution as well construction of 3D datasets by serially ablating layers of sample during image acquisition. A recent 3D TOF-SIMS study was able to profile up to 189 compounds in FFPE tonsil tissue sections which were also spatially mapped to cells using isotope-tagged antibodies and inductively coupled plasma mass spectrometry 20.
Data Analysis of metabolomics datasets – Introducing Metabolite Explorer
As with other MSI applications, analysis of metabolomics datasets can include co-registration of the MSI data with histological annotations and statistical analysis of the overall data. But of course, you’d want to assign specific peaks to metabolite identifications, which is possible when using high mass-resolving instruments. Developed in collaboration with top pharmaceutical company Boehringer Ingelheim 21, Metabolite Explorer is a web-based tool from Aspect Analytics designed to simplify the high-throughput, targeted screening analysis of drugs, biomarkers and other candidate molecules from multiple MSI experiments, while also enhancing standardization and reproducibility across studies. Metabolite Explorer allows the structured comparison of MSI experiments by using meta-information related to the experimental study, such as the samples measured (e.g., animal number, dosage level) and metabolites of interest (e.g., SMILES formulas, relevant bio-transformations). Users can then create and configure their own screening criteria, such as stratifying groups for statistical analysis and filters for relevant ion images, e.g., detect an upregulation of specific ions in treated samples vs. controls.
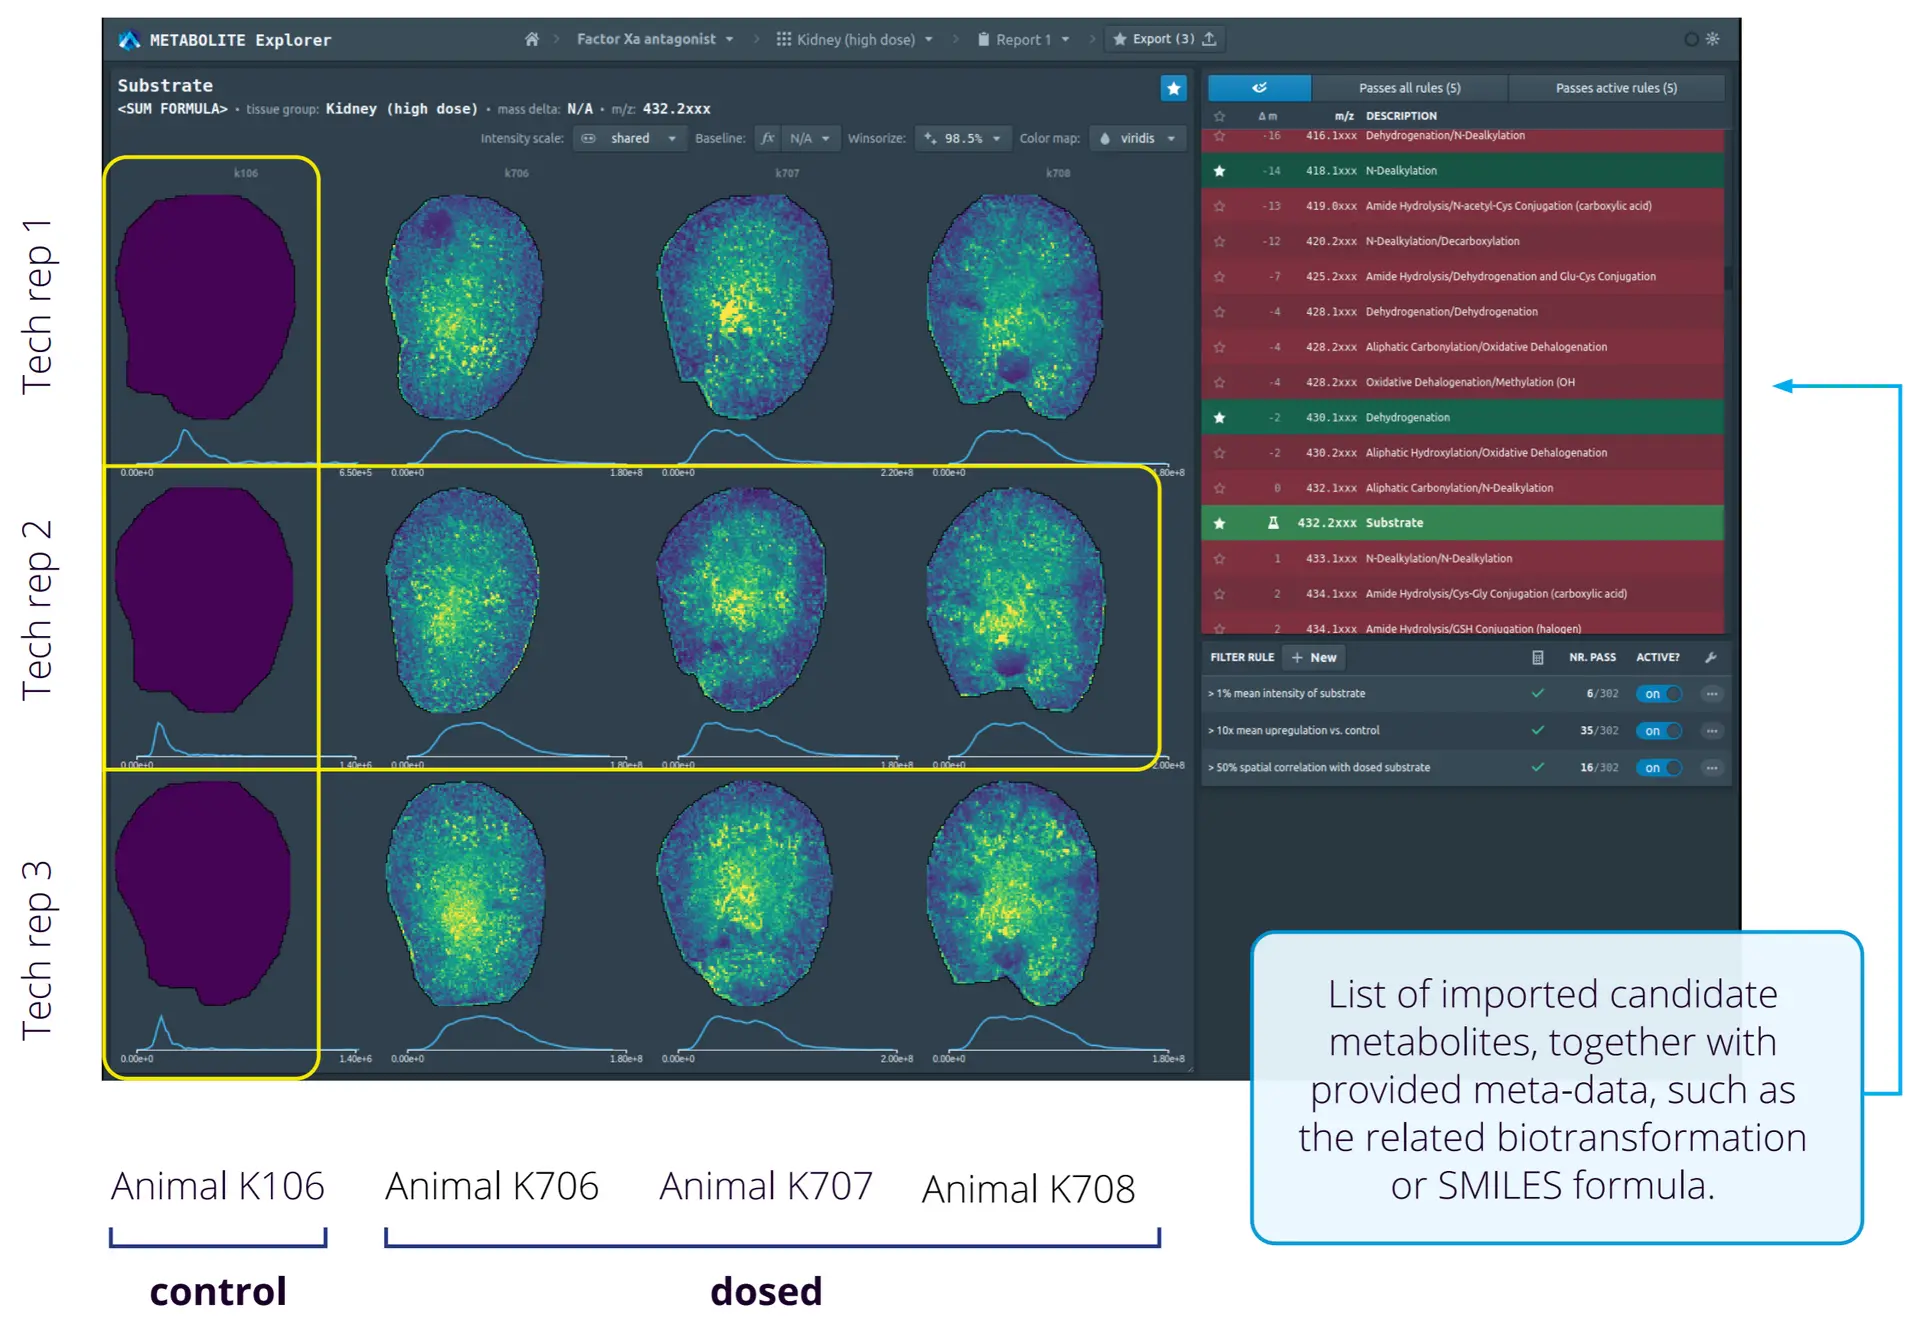
Metabolite Explorer also automatically generates a structured report summarizing key conclusions of the analysis, significantly reducing human effort and errors that may arise from manual report construction. In addition, exporting a report locks the associated analysis to prevent modification and generates a weblink allowing sharing of the analysis results with collaborators and stored for permanent future reference. The locking of the analysis and link generation thus provides an overview of the entire screening pipeline and extra information in addition to the generated report files.
READ MORE ABOUT METABOLITE EXPLORER
Conclusion
In this post, we discuss MSI for metabolomics and drugs, the instrumentation and sample preparation used, and introduced Aspect Analytics’ Metabolite Explorer tool for data analysis. For more information about Metabolite Explorer or if you have questions about analysis of your drug or metabolomics mass spectrometry study, feel free to contact Aspect Analytics for data analysis options.
References:
1. Fiehn O. Combining genomics, metabolome analysis, andbiochemical modelling to understand metabolic networks. Comp Funct Genomics2001;2:155-68
2. Wishart DS. Proteomics and the human metabolomeproject. Expert Rev Proteomics 2007;4:333-5.
3. Randall EC, Emdal KB, Laramy JK, et al. Integratedmapping of pharmacokinetics and pharmacodynamics in a patient-derived xenograftmodel of glioblastoma. Nat Commun 2018;9:4904.
4. Randall EC, Lopez BGC, Peng S, et al. LocalizedMetabolomic Gradients in Patient-Derived Xenograft Models of Glioblastoma.Cancer Res 2020;80:1258-67.
5. Knitsch R, AlWahsh M, Raschke H, Lambert J, HergenroderR. In Vitro Spatio-Temporal NMR Metabolomics of Living 3D Cell Models. AnalChem 2021;93:13485-94.
6. Goodwin RJA, Takats Z, Bunch J. A Critical and ConciseReview of Mass Spectrometry Applied to Imaging in Drug Discovery. SLAS Discov2020;25:963-76.
7. Sun N, Fernandez IE, Wei M, et al. Pharmacometabolicresponse to pirfenidone in pulmonary fibrosis detected by MALDI-FTICR-MSI. EurRespir J 2018;52.
8. Dexter A, Steven RT, Patel A, et al. Imaging drugs,metabolites and biomarkers in rodent lung: a DESI MS strategy for theevaluation of drug-induced lipidosis. Anal Bioanal Chem 2019;411:8023-32.
9. Sahin M, Neumann JM, Riefke B, et al. Spatialevaluation of long-term metabolic changes induced by cisplatin nephrotoxicity.Toxicol Lett 2020;334:36-43.
10. SchulzS, Becker M, Groseclose MR, Schadt S, Hopf C. Advanced MALDI mass spectrometryimaging in pharmaceutical research and drug development. Curr Opin Biotechnol2019;55:51-9.
11. BuckA, Balluff B, Voss A, et al. How Suitable is Matrix-Assisted LaserDesorption/Ionization-Time-of-Flight for Metabolite Imaging from ClinicalFormalin-Fixed and Paraffin-Embedded Tissue Samples in Comparison toMatrix-Assisted Laser Desorption/Ionization-Fourier Transform Ion CyclotronResonance Mass Spectrometry? Anal Chem 2016;88:5281-9.
12. BruinenAL, van Oevelen C, Eijkel GB, et al. Mass Spectrometry Imaging of Drug RelatedCrystal-Like Structures in Formalin-Fixed Frozen and Paraffin-Embedded RabbitKidney Tissue Sections. J Am Soc Mass Spectrom 2016;27:117-23.
13. GiampaM, Lissel MB, Patschkowski T, et al. Maleic anhydride proton sponge as a novelMALDI matrix for the visualization of small molecules (<250 m/z) in braintumors by routine MALDI ToF imaging mass spectrometry. Chem Commun (Camb)2016;52:9801-4.
14. NeumannJM, Niehaus K, Neumann N, et al. A new technological approach in diagnosticpathology: mass spectrometry imaging-based metabolomics for biomarker detectionin urachal cancer. Lab Invest 2021;101:1281-8.
15. LonguespeeR, Wefers AK, De Vita E, et al. Rapid detection of 2-hydroxyglutarate in frozensections of IDH mutant tumors by MALDI-TOF mass spectrometry. Acta NeuropatholCommun 2018;6:21.
16. BuckA, Ly A, Balluff B, et al. High-resolution MALDI-FT-ICR MS imaging for theanalysis of metabolites from formalin-fixed, paraffin-embedded clinical tissuesamples. J Pathol 2015;237:123-32.
17. IsbergGO, Xiang Y, Bodvarsdottir SK, et al. The effect of sample age on the metabolicinformation extracted from formalin-fixed and paraffin embedded tissue samplesusing desorption electrospray ionization mass spectrometry imaging. J MassSpectrom Adv Clin Lab, 2021; 22:50-55.
18. MerdasM, Lagarrigue M, Umbdenstock T, et al. Study of the Distribution ofAcetaminophen and Its Metabolites in Rats, from the Whole-Body to IsolatedOrgan Levels, by Matrix-Assisted Laser Desorption/Ionization Mass SpectrometryImaging after On-Tissue Chemical Derivatization. Anal Chem 2021;93:13242-50.
19. ZhouQ, Fulop A, Hopf C. Recent developments of novel matrices and on-tissuechemical derivatization reagents for MALDI-MSI. Anal Bioanal Chem2021;413:2599-617.
20. GaneshS, Hu T, Woods E, et al. Spatially resolved 3D metabolomic profiling intissues. Sci Adv 2021;7.
21. MoermanT , Becker T , Verbeeck N , Claesen M. Metabolite Explorer: A Software Tool forTargeted Analysis of Mass Spectrometry Imaging Data. ASMS 2020 Reboot