The Power of Cellular Neighborhood Analysis
Biology doesn't happen cell by cell, it happens in neighborhoods. Where a cell sits matters as much as what it is. Weave’s Cellular Neighborhood analysis turns tissue architecture into a quantitative, comparable readout - from identifying neighborhoods, to statistical and bioinformatics analysis, yielding biomarkers and testable hypotheses.

TL:DR:
- Cellular Neighborhood analysis transforms spatial biology from single-cell observation into systems-level understanding.
- Weave® provides tools for users to identify recurring Cellular Neighborhoods, use them for traditional bioinformatics, and understand what they really mean.
- These tools help researchers interpret Cellular neighborhoods and answer complex questions about cell-cell interactions, pathway activity, and microenvironment composition across entire sample cohorts.
What are the bottlenecks of mapping Cellular Neighborhoods in spatial biology?
The biomedical research community has adopted spatial biology methods to tackle questions such as “What are the differences that I can resolve against treated versus untreated samples?”, “What characterizes responders versus non-responders?”, or “Does cell A interact with cell B in my samples?”
The status quo of data analysis in the spatial biology field is primarily the ability to visualize the location of individual cells or cell types in tissue, for example, identifying whether CD4+ T cells infiltrate a tumor. Most analysis pipelines were developed and established for the single cell field, with some spatial information taken into consideration.
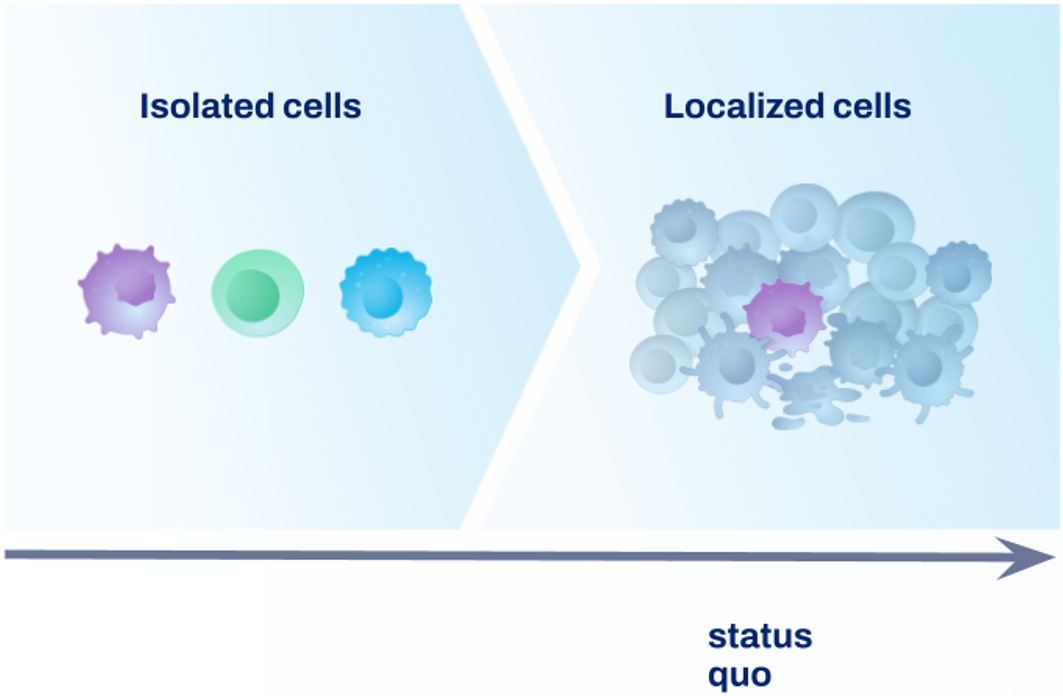
But biology doesn't happen cell per cell, it happens in Cellular Neighborhoods, also known as cell niches, spatial domains or cell environments. Where a cell sits matters as much as what it is. While some questions can be answered with single cell tools, these approaches have more difficulty with complex questions. Questions such as "Does cell type A express the same signature when it is with cell type B and cell C?" are more difficult for single cell approaches to answer.
Add in the spatial biology field maturing: from looking at one sample with one assay, to now approaching cohort-level studies and asking what differences can be resolved in datasets exceeding one million cells over 10+ samples, identifying and understanding Cellular neighborhoods becomes a real challenge.
How does Weave support mapping of spatial Cellular environments?
Weave® has built-in tools to identify, interpret, and inventorise Cellular Neighborhoods as units and across multiple samples. Weave’s tools cover finding the neighborhoods, describing the cells within them, and conducting statistical and bioinformatics analysis to understand what the Cellular Neighborhoods mean. Instead of analysing cells in isolation, this turns tissue architecture into a quantitative, comparable readout.

Using Weave’s proprietary approach, users can calculate the spatial fingerprint for every cell in the dataset to a defined distance. This generates a ‘social network’ that defines not only which cells occur near others across every sample, but how they are organized spatially.
Once neighborhoods are defined, you can perform any conventional bioinformatics analysis, such as find clusters of cells that are spatially coherent, look for differential expression or embed cells based on spatial proximity. This can be performed across a whole cohort of samples.
For example, if you find a certain spatial fingerprint that seems to be heavily enriched in responders, the next questions are what does this mean? What am I looking at? Weave addresses this via descriptive statistics that ranges from the simple analysis of cell type frequency, what's in the Cellular Neighborhood, to permutation tests comparing if cell types are more attracted to each other than you would expect in a given environment.
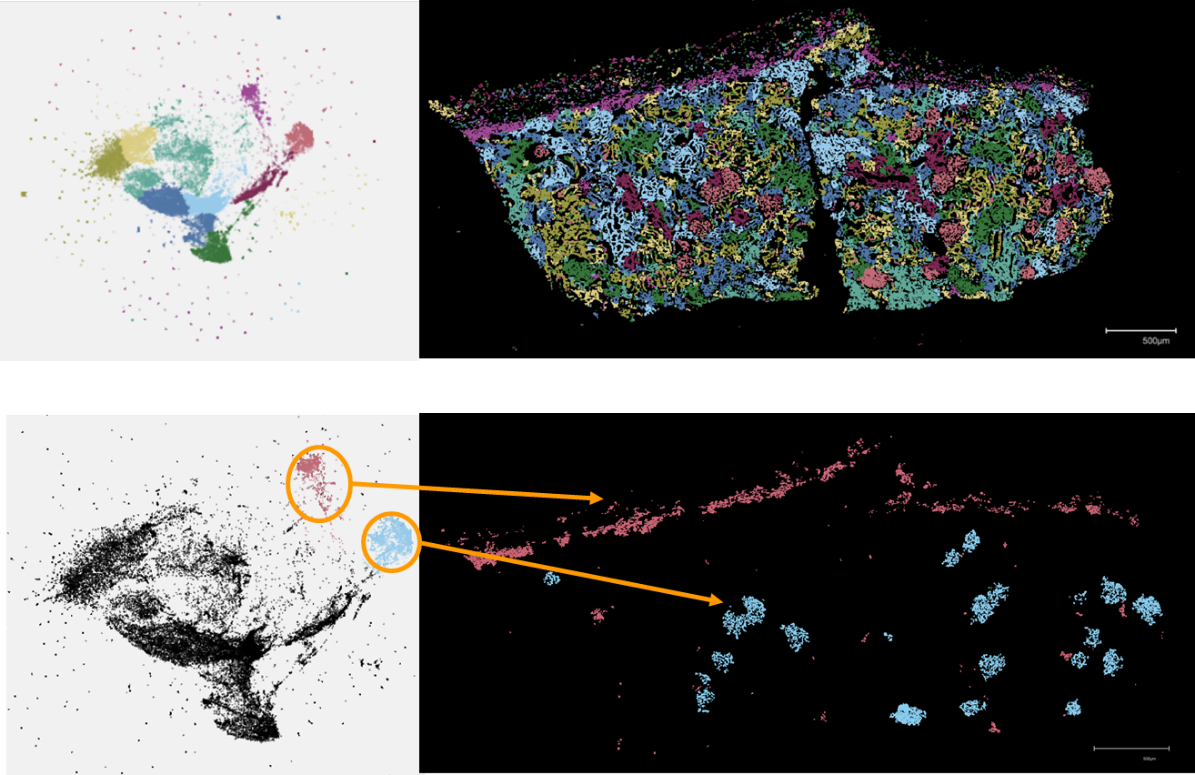
Cellular Neighborhoods therefore combine the two powerful but separate fields of molecular biology and histology.
How can using Cellular Neighborhoods drive insights and actions?
By combining gene and protein signatures with tissue architecture, Cellular Neighborhoods can provide new insights across all tissue-based disease areas, forming a new class of spatio-molecular biomarkers. Cellular neighborhood analysis can be used in a variety of ways from basic research to clinical studies. This includes discovering spatial cell clusters that are associated with disease progression, understanding how they change in response to drug treatment, and then using those structures to stratify patients in clinical trials.
All tissue-based disease areas where the spatial organization of cells and structures can be used are suitable for Cellular Neighborhood analysis. Examples include oncology and autoimmunity, where scientists can spatially simultaneously analyze multiple cell types or markers in order to understand disease mechanisms or understand response or non-response to therapy. Here are two examples:
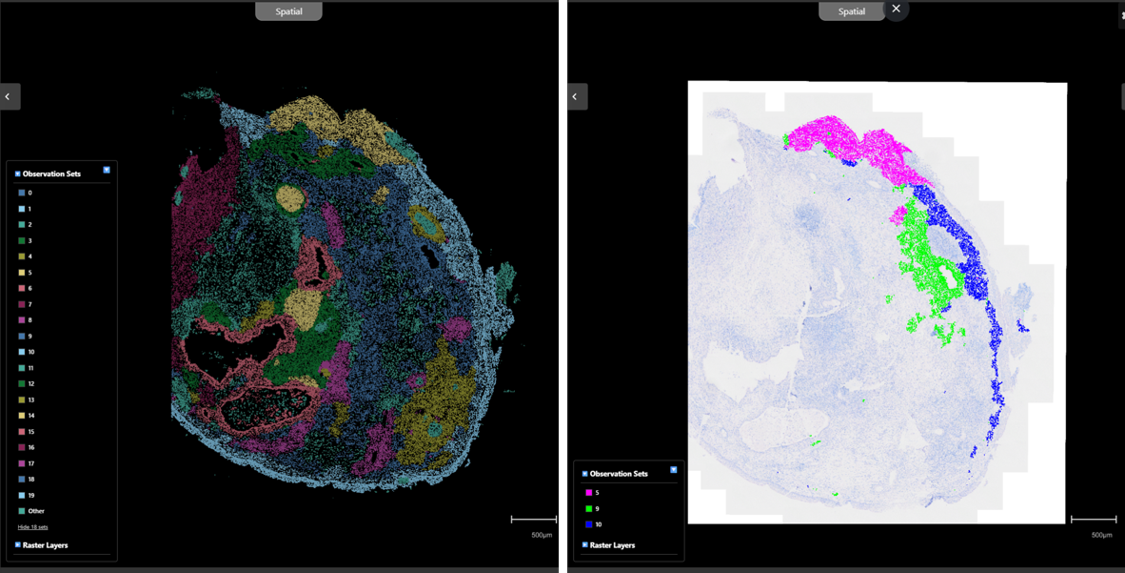
Nasal polyps affect 10–15% of the population but a core challenge is that while eosinophils are a key diagnostic marker of chronic rhinosinusitis with nasal polyps (CRSwNP), these cells are difficult to molecularly profile. In a pilot study, Weave analyzed a nasal polyp section probed with a 48-marker multiplexed immunofluorescence (mIF) panel using the Bruker Spatial Biology CellScape™ platform followed by H&E staining. Weave co-registered both datasets at single-cell precision and confirmed that CD66b-labelled cells in the mIF data corresponded to H&E-identified eosinophils. Cellular Neighborhood analysis identified 20 spatially recurring neighborhoods with eosinophils concentrated in neighborhoods 5, 9, and 10. Further analysis revealed eosinophil–M2 macrophage interactions in neighborhoods 9 and 10, whereas eosinophils in neighborhood 5 colocalize with plasma cells and CD4+ memory T-cell. These findings provide deeper characterization of tissue microenvironments in inflammatory disease — offering a path toward understanding treatment resistance in CRSwNP.
In this study, a non-small cell lung cancer (NSCLC) biopsy was measured with a Xenium spatial transcriptomics, COMET spatial proteomics and H&E. We used the spatial proteomics data to conduct cell segmentation, and the spatial transcriptomics data to assign cell type annotations. 18 different cell types were detected. Using Cellular Neighborhood analysis, malignant cells were found to correspond to three different neighborhoods. Learn more in the below video:
How can Cellular Neighborhoods bring value to your team?
What is the future of Cellular Neighborhood analysis?
Looking at spatial biology data can sometimes feel like looking at stars in the night sky – dark, mysterious, and knowing that there’s so much there but not knowing where and how to start using it to get from point A to point B. Weave has tools to make sense of spatial biology data, moving beyond localizing cells into a tissue to putting you on the path of finding Cellular Neighborhoods and understanding what they mean. But environments alone in a project is not enough. We are establishing software frameworks to make databases and atlases of Cellular Neighborhoods, with the vision that users can define ontologies of multicellular structures. Think of it as having environment types, analogous to cell types, with modifiable ontology trees to put data in in a way that is interpretable.
Conclusion
Cellular Neighborhood analysis transforms spatial biology from single-cell observation into systems-level understanding. Weave provides an integrated workflow, from identifying Cellular Neighborhoods to statistical interpretation, enabling researchers to identify, characterize, and compare cell neighborhoods across cohorts. As the field matures, we see atlases with structured ontologies will make insights into cellular neighborhoods reusable, searchable, and biologically actionable.
Download the CRSwNP study application note.
Learn more about the NSCLC dataset.