Mapping the invisible chemistry of the brain - A Sterol and Steroid Atlas of Mouse Brain
TL:DR
- Cholesterol and neurosteroids play key roles in brain signalling, neuronal activity, and stress response, but their spatial distribution has been historically under-mapped due to detection challenges.
- Prof. Griffiths and Dr. Khan developed on-tissue chemical derivatisation methods to detect these molecules using mass spectrometry imaging (MALDI-MSI and LESA-MSI).
- Aspect Analytics transformed the raw imaging data into a 3D interactive atlas of the mouse brain, co-registered to the Allen Mouse Brain Atlas.
- Users can zoom from whole brain sections down to individual 50-micron pixels, toggling between molecules, sexes, and datasets — no coding required.
- The atlas reveals how cholesterol metabolism varies across regions like the striatum and cerebellum.
- Funded by BBSRC, Welsh Government, and the University of Edinburgh; public release and an accompanying publication are expected soon.
In the brain, cholesterol and neurosteroids have roles in maintaining various brain functions, such as acting as signalling compounds, modulating neuronal activity, and shaping stress responses. Despite their importance, the distribution of steroids and sterols in the brain are under-reported due to the difficulty in detecting members of these molecular families. Mass spectrometry imaging (MSI) has proven abilities to map lipid species and other compounds across tissue sections. Prof. William Griffiths from Swansea University and Dr. Shazia Khan from University of Edinburgh developed on-tissue chemical derivatisation approaches to detect neurosteroids and sterols in the brain using MALDI-MSI and LESA-MSI. But having solved the issue on how to collect that data, Prof. Griffiths and Dr. Khan faced the issue of turning it into something researchers can actually explore.
Atlases in Spatial Biology: Mapping Tissue in Its Native Context
Spatial biology has transformed how researchers understand tissue organization by preserving the physical location of cells and structures in tissue while measuring their molecular identity. Rather than treating tissues as a collection of dissociated cells, spatial biology techniques let scientists ask not just which cells are present, but where they sit relative to one another, what they express, and why that arrangement matters. Following this shift, we are increasingly seeing spatial biology atlases using spatial transcriptomics and spatial proteomics across different organs and disease conditions.
These atlases serve as foundational references against which new datasets can be compared. A well-built atlas of a healthy organ can provide researchers a baseline for identifying changes due to disease, aiding discoveries in cancer, autoimmune conditions, and neurodegeneration. When integrating different data types, such as omics data with histology or other imaging, atlases enable cross-referencing between with tissue architecture in ways that single-modality studies cannot.
Despite their promise, building spatial atlases carry real constraints. They require special investment in sample collection and standardized protocols. Differences across experimental acquisitions, labs, platforms, and donors can introduce technical noise that complicates integration. After data acquisition, finding the right computational infrastructure to manage the generated data and allow exploration at scale can be an additional challenge.
A 3D Sterol and Steroid Atlas of Mouse Brain
When Dr. Khan and Prof. Griffiths wanted to build an atlas to map the distribution of neurosteroids and sterols across the brains of adult male and female mice, they turned to Aspect Analytics.
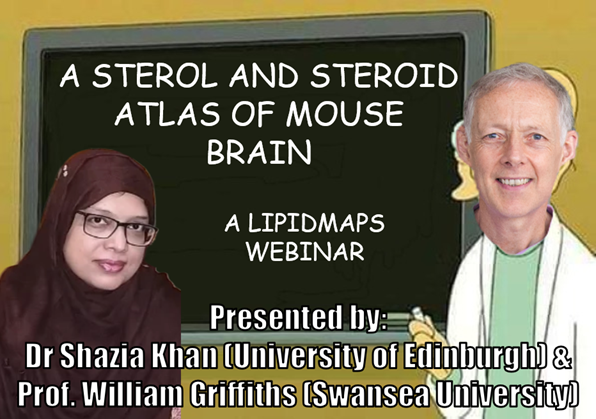
In a recent LIPIDMAPS webinar, Prof. Griffiths Dr. Khan shared how they built a 3D sterol and neurosteroid atlas of the mouse brain with their MS imaging data registered onto appropriate plates to show annotations from the Allen Mouse Brain Atlas. The result: an interactive tool where users can zoom from a whole brain section down to individual 50-micron pixels, toggle between molecules, sexes, and datasets, and instantly see how cholesterol metabolism lights up specific regions like the striatum or cerebellum.
Behind that atlas: Aspect Analytics, who took the raw imaging output, completed the co-registrations, and built it into a clean, web-based interface with spatial, plot, and table views — no coding or specialist software required to explore it.
This is the power of a good spatial atlas: it turns a complex, high-dimensional dataset into something intuitive enough for any researcher to query, compare, and build new hypotheses from — accelerating discovery long after the original experiment is done.
The atlas is set for public release in the coming months. A publication is coming soon. This collaboration was funded by the Biotechnology and Biological Sciences Research Council (BBSRC), Welsh Government, and University of Edinburgh.
Contact us if you have questions about this study or would like to learn more about how Weave can support your own tissue atlassing project.