Spatial omics 4 - Antibody visualization: from microscopy to mass spectrometry
Following on from the last blog, so you're doing immunohistochemistry and want to know how to view it? Here's our overview entry on the different methods involved.
Access publication.webp)
Following on from the last blog, so you're doing immunohistochemistry and want to know how to view it? Here's our overview entry on the different methods involved.
This post is part of our series titled "Introduction to spatial omics", which contains the following entries:
- Spatial omics part 1: the history and how of histology
- Spatial omics 2 – Mixing Modern Methods mit Microscopy
- Spatial omics 3 – proteomics with immunolabelling
- Spatial omics 4 - Antibody visualization: from microscopy to mass spectrometry (current post)
Table of contents
If you cast your minds back a few months, I finished the last blog by saying that an explanation of viewing your immunolabelled samples would be in another blog entry. Here we are at last – the promised entry on different ways to visualize your immunolabelled tissue sections! *cracks knuckles*
Introduction (or refresher)
To recap the last entry, we discussed the principles behind how immunohistochemistry works and the definition of different terms used in the technique. The entry mentioned that there are different methods to visualize the immunolabelled tissue, largely depending on what kind of label is conjugated to the antibodies. At present, these labels fall mainly into three categories:
- Chromogenic precipitates that can be viewed with brightfield microscopes,
- Fluorophores visualized via fluorescence microscopy
- Tags that can be detected via mass cytometry or mass spectrometry instruments. In this entry, we will explore these a bit more, how the technology works and their various pros and cons.
Also, I won’t go into the physics of how microscopy works, but the Olympus Lifescience Microscopy website is a pretty good resource with multiple pages covering different aspects of microscopes and optical microscopy, if you’re curious.
Microscopy with chromogenic stains
As mentioned in the previous blog, chromogenic IHC uses an enzymatic reaction to produce an insoluble colored precipitate at the antigen site. While the most commonly used enzyme and substrate combination (HRP and DAB) produces a brown stain, there are commercially available kits for red, blue or black, such as these from Vector Laboratories.
Perhaps the greatest benefit of chromogenic IHC is that it can be viewed on pretty much any brightfield (light) microscope – fancy equipment not required! Yes, this means that you could view it on the latest top of the line compound microscope, but you could also view it on that antique early 20th century microscope that’s been sitting on the shelf at the back of the lab for generations.

Basic light microscopes use lenses to bend visible light and optically magnify samples, so while the designs have changed, this basic principle of microscopy won’t. However, the lack of fanciness is also a limitation as the ability to discriminate different colours and their intensities is dependent on the viewer, making multiplexing with chromogenic IHC difficult. This is where fluorescent microscopy becomes useful.
Fluorescent probe microscopy
Fluorescent probes are generally the preferred method for multiplexed IHC because of the relative ease of separating different colour channels – three, four, five probes? With the right labels and a fluorescence-enabled microscope, you can do this pretty easily. If for example you have a piece of brain tissue and want to label for neurons, glia and nuclei, such as in the image below, all you would have to do is make sure you have probes corresponding to different ranges of the visual spectrum and a microscope that can separate them.
Fluorescence microscopes typically require an intense light source, such as mercury burning lamps or lasers – daylight or normal tungsten lamps won’t cut it, I’m afraid – and filters to limit the light to specific regions in the electromagnetic spectrum. Going all the way back to middle or high school science, the visual spectrum through which human eyes perceive colour corresponds to a window ranging approximately 380nm (violet) to 740nm (red). Fluorescent dyes (e.g. fluorescein isothiocyanate FITC, which is green) and fluorescent proteins (e.g. mCherry – a red fluorescent protein) absorb light energy (excited) at one wavelength and emit their signal at another. Thus, filters are used so that only light of specific wavelengths can hit the sample to excite the fluorophores. There are lots of different types of fluorescent microscopes, from simple epifluorescence to more complex confocal laser scanning systems, two-photon, or light sheet microscopy, but all are typically either kept in a dark room or have an enclosed stage. This is to limit the sample’s exposure to visible light and limit bleaching of the probes, but also because visible light can interfere with subtle detail of fluorescent images.
To use fluorescent probes in IHC, all you need to do is either have your primary or secondary antibodies conjugated to a probe, taking care that the emission spectra of the probes don’t overlap too much so that you can be certain of the signal’s origin, and have a microscope with an appropriate light source and spectral filters to detect the probe/s. Not sure what I mean? Refer to figure 1 source or this online tool where you can check if the combination of different probes and light sources can be used together.
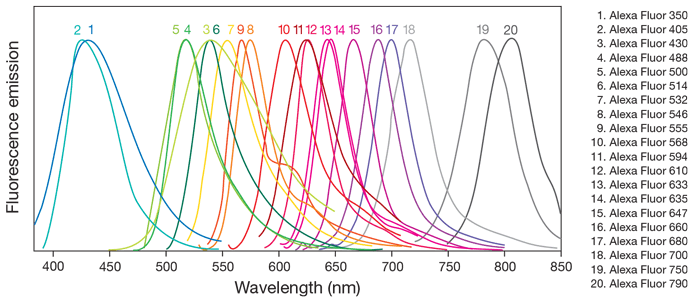
Figure 1 shows that while there are 20 AlexFluor dyes, a lot of them have overlapping emission spectra, indicating which probes can be used together and which cannot. Using the triple labelled brain from before, let’s assume the Purkinje neuronal antibodies were tagged with AlexaFluor 488 (curve 4 green), the Bergmann glia with AlexaFluor 594 (curve 11, red), and the nuclei were stained with DAPI (blue). This combination works because the emission curves are well separated. Depending on the filters available on the microscope, labelling the two cell populations with AlexaFluor 488 and AlexaFluor 532 (curve 7, yellow) might work because the emission spectra do not completely overlap, however AlexaFluor 488 should not be used with AlexaFluor 500 (curve 5, green), eGFP or FITC because the emission spectra is too similar.
This spectral overlap and filter situation has historically limited multi-spectral imaging, not just for IHC but also in-situ hybridisation, to about maximum 10 labels (not bad compared with chromogenic!), but can now be overcome with more novel technology.
Multiplexed Immunofluorescence with cyclic methods
Remember how I said fluorescent probes can be bleached by exposure to light? Higher multiplexing of IHC can be achieved by exploiting this, such as that used by t-CyCIF 1. This technique uses cycles of antibody staining for three protein markers, staining for nuclei, image acquisition for the four different channels on standard fluorescent microscopes, and then a step where the antibody fluorophores are bleached by washing in hydrogen peroxide in white light for one hour. Using repeated cycles of these steps and stitching together of images using the nuclei as a guide, the authors demonstrated labelling of up to 60 different proteins, using standard laboratory equipment.
Another cyclic fluorescent IHC technique that’s been generating a lot of buzz is the CODEX/Phenocycler system from Akoya. In conventional fluorescent IHC, antibodies are directly tagged with the fluorophore, but for the CODEX technique both antibodies and fluorophores are tagged with oligonucleotide sequences (referred to as barcodes). This allows the tissue sample to be initially stained with all the barcoded antibodies in the study, followed by sequential rounds of adding the barcoded fluorophores (maximum three per round to avoid spectral overlap) which are annealed to the complementary antibody barcode, imaging, and dehybridisation to remove the fluorophores from the sample, before the next round of annealing 2 (Figure 2).
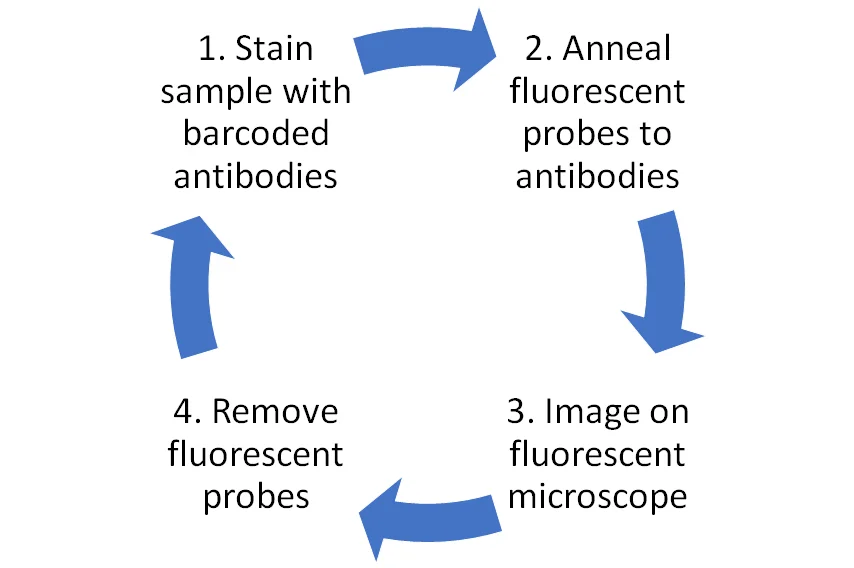
For this technique, the proprietary CODEX device from Akoya is required for the antibody-fluorophore binding to occur, but imaging can be conducted on either third-party fluorescent microscopes or Akoya’s own Vision device.
Mass spectrometry-based detection methods
Remember in the first blog in this series where we broke down that “immunohistochemistry” actually means using antigen/antibody interactions (immuno-) to examine tissue (histo) with a chemical method of detection? Did you notice how the suffix -scope (to observe) isn’t anywhere in the word? That’s because it’s not tied to any particular technique! So while IHC is traditionally linked to visual observation using microscopes, chromogens and fluorophores, the development of antibody tags that can be detected via mass spectrometry or cytometry has increased multiplexed imaging options.
Metal tagged antibody detection with mass cytometry imaging
Antibodies conjugated to ionizable metal tags are the key to mass cytometry imaging techniques: the MIBI from Ionpath and IMC from Standard Biotools (formerly Fluidigm). In fact, a blog on Standard Biotools’ own website actually says “…if you know IHC, you already know IMC.” I’ve talked briefly about MIBI and IMC before so I won’t go into detail, but the tissue samples are incubated with all antibodies (~30) at the same time, and the metal ion tags are ablated by either an ion beam or laser, allowing simultaneous detection of all markets in one measurement. While the ion signals from both MIBI and IMC don’t have issues with sample autofluorescence, low background due to high mass-resolving capabilities of the instruments, and subcellular resolution, some negatives are the slow rate of acquisition relative to microscopy, necessity for pure and vacuum stable metal tags, and specialized mass spectrometers with limitations for other applications.
Peptide tags detected by MALDI-MS Imaging
If you’ve read our blogs, you’ll know that metals aren’t the only thing that can be detected via mass spectrometry imaging, but also that imaging proteins is challenging in MSI because of reasons outlined in this blog entry. Yagnik et al reported the simultaneous detection of 12 different proteins using antibodies conjugated with photocleavable peptide mass tags (PC-MTs) and MALDI-MSI, termed MALDI-IHC by the authors 3, although their website claims capabilities of over 100+ antibodies. The sample preparation for MALDI-IHC follows typical IHC protocol for both FF and FFPE samples, with the addition of an incubation step in a UV-light box to cleave the PC-MTs. This step creates an ionizable peptide at the site of the bound antigens/antibodies. This is then followed by a step where the sample is coated in matrix before measurement in a MALDI-mass spectrometer following typical measurement parameters. Unlike their metal-tagged antibody counterparts, the authors report that their antibodies can also be conjugated with a fluorophore for dual fluorescent and MALDI-IHC of the same section. This double labeling/double imaging can be useful in multiple ways - from validating that the signal from the MALDI Imaging and microscopy is consistent, to conducting image fusion to improve the spatial resolution of the MALDI data as well as derive insights that can’t easily be derived from one modality alone 4. In addition, Yagnik et al demonstrated the possibility to conduct standard MALDI-MSI, such as lipid imaging, and MALDI-IHC sequentially on the same tissue section. Needless to say, the potential to perform multiple spatial omics analyses using one tissue section as opposed to multiple sections is mouth watering (to me, at least).
Summary
This blog covered some of the detection methods for IHC – ranging from microscopy of chromogens and fluorophores, to more sophisticated mass spectrometry-based techniques. If you’re looking for some tips on IHC image and other spatial omics analysis, contact Aspect Analytics for ideas.
References:
- Lin JR, Izar B, Wang S, et al, Highly multiplexed immunofluorescence imaging of human tissues and tumors using t-CyCIF and conventional optical microscopes, Elife, 2018
- Goltsev Y, Samusik N, Kennedy-Darling J, et al. Deep Profiling of Mouse Splenic Architecture with CODEX Multiplexed Imaging. Cell 2018;174:968-81 e15
- Yagnik G, Liu Z, Rothschild KJ, et al, Highly Multiplexed Immunohistochemical MALDI-MS Imaging of Biomarkers in Tissues, Anal Chem, 2021
- Van de Plas R, Yang J, Spraggins J et al., Image fusion of mass spectrometry and microscopy: a multimodality paradigm for molecular tissue mapping, Nat Methods, 2015