Spatial omics 2 – Mixing Modern Methods mit Microscopy
Continuing the series of blogs on spatial omics, let's look at how ye olde histology techniques aid and are being integrated into modern omics.
Access publication
Continuing the series of blogs on spatial omics, let's look at how ye olde histology techniques aid and are being integrated into modern omics.
This post is part of our series titled "Introduction to spatial omics", which contains the following entries:
- Spatial omics part 1: the history and how of histology
- Spatial omics 2 – Mixing Modern Methods mit Microscopy (current post)
- Spatial omics 3 – proteomics with immunolabelling
- Spatial omics 4 - Antibody visualization: from microscopy to mass spectrometry
Table of contents
Introduction
To recap from before: after spending a few blogs saying classical histological techniques weren’t up to scratch, I then said #histologyneverdies because the spatial context of cells and tissues is too important to overlook. I ended by saying histology and microscopy would likely be used in the following ways:
- Be used to aid more powerful analytical techniques where current histology and microscopy capabilities are limited; and
- Technologies will adopt aspects of histology/microscopy so that they can be conducted spatially.
So let’s jump in.

Using histology to define analysis
An example of where something similar to number 1 already happened is the adoption of mass spectrometry in microbiology. Compared to conventional methods, microbial identification using MALDI-TOF combined with antimicrobial stewardship team intervention significantly decreased the time to organism identification and optimal treatment, which was associated with shorter stays in ICU and a decrease in mortality1. However, lab workflows still include Gram staining and microscopic analysis of their positively cultured samples. Potential areas where something similar could happen for histology is the use of MSI for cancer classification. Subtyping of non-small cell lung carcinoma (NSCLC), required for appropriate diagnosis and treatment, is currently conducted using an IHC antibody panel on multiple tissue sections. MALDI-MSI has been shown to subtype NSCLC with similar sensitivity and specificity to IHC using one section2,3. This is particularly useful as lung biopsies are small and the sample can be used for other analyses e.g. genetic testing. The diagnosis of the skin cancer melanoma is another area where it has been demonstrated that MALDI-MSI could provide diagnoses, particularly so for samples which are histologically ambiguous4,5.
To correctly classify tissue however, requires building a classifier using signal from relevant histological areas for accuracy and then likewise applying that classifier to relevant sample. A 2018 study found that including non-tumor cells in a classifier decreased the accuracy6, which makes sense as non-tumor regions contain irrelevant and confounding elements. Both the NSCLC and melanoma studies above used histological analysis to make sure only tumor signals were used in their classifier: the lung studies stained their samples with H&E and histology after measurement and limited their classifier-building data to spectra from cancer cells 2,3, while the skin cancer studies used an adjacent H&E-stained slide to make sure that they measured from regions that only had cancer 4,5.
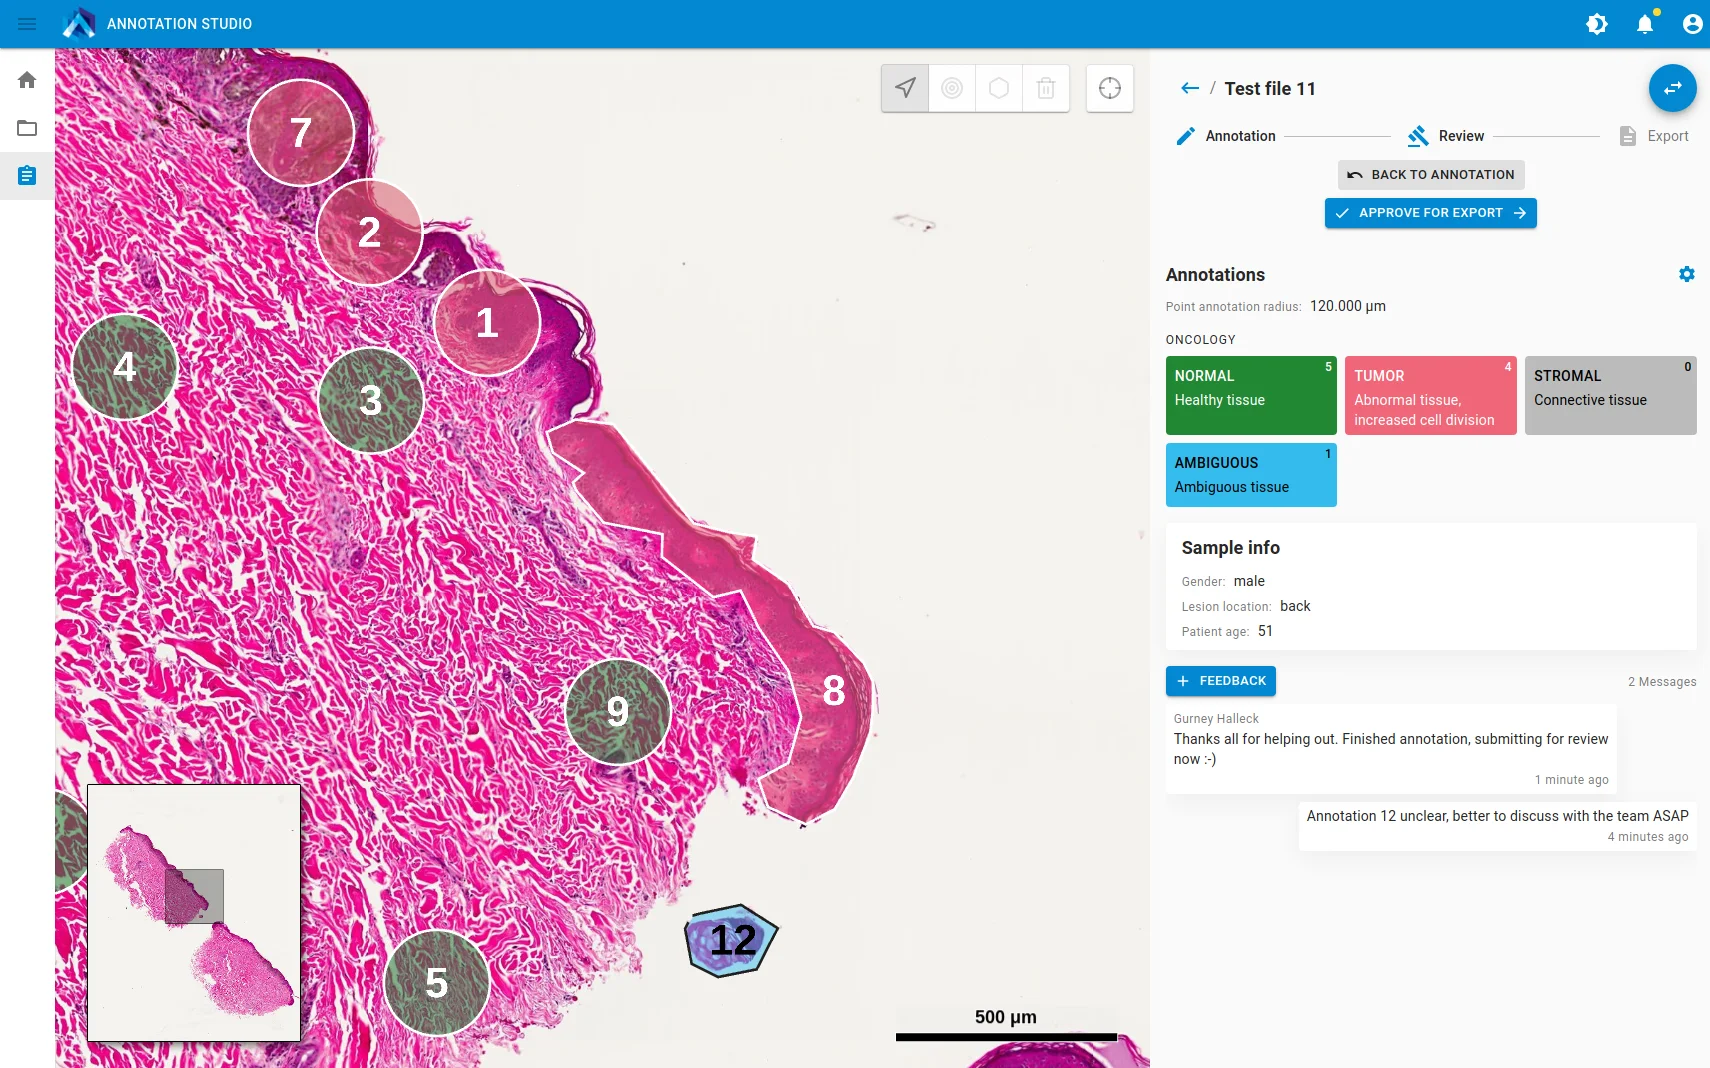
For the study by Al-Rohlil et al., Aspect Analytics and the fellow authors teamed up to develop a software package and workflow that allowed pathologists to remotely annotate digitised H&E slides, which would inform laboratory technicians which regions to measure on their samples, streamline the data processing for a bioinformatician to review, and then generate a report of the case.
The rise of Spatial Transcriptomics
An example of a technology that has adopted aspects of histology for spatial analysis is spatial transcriptomics. Genetic sequencing techniques were developed using extracted DNA, which is fine if you’re looking for overall readings. However, while all cells in the body have more or less the same DNA, the transcriptome differs from cell to cell, thus understanding the origin of the readout is essential. Spatial Transcriptomics is a method that allows visualization and quantitation of RNA in tissue sections and was declared the Nature Methods 2020 method of the year 7. If we want to be super technical, in-situ hybridization (ISH) on tissue sections was the first Spatial Transcriptomic technique, although the term wasn’t coined until 2016 8. There are a number of different available Spatial Transcriptomics platforms which are largely conducted either by fluorescence ISH (FISH), in-situ sequencing, or spatial capturing of RNA and ex-situ RNA sequencing, with each method having different levels of spatial resolution, throughput and coverage 7. For the sake of simplicity, I will cover the following commercially available platforms: Visium Spatial Gene Expression from 10x Genomics, GeoMx Digital Spatial Profiler from Nanostring, MERFISH from Vizgen and RNAScope from Advanced Cell Diagnostics. Both Visium and GeoMx are examples of in situ capturing/ex-situ sequencing from tissue sections while RNAScope and MERFISH uses FISH. All four methods are compatible with FF and FFPE samples.
RNAScope
- First reported in 2012 9, this technique uses proprietary ‘ZZ’-shaped oligonucleotide probe pairs with each probe consisting of a complementary region (18-25 bases) to hybridize the target, a spacer sequence and base sequence of 14 pairs.
- After the tissue section is mounted on a slide, permeabilized, and hybridized with the ZZ target probe pair, a second hybridization step is used to attach a pre-amplifier probe to the 28-base binding site (formed by the two 14-base sequences). This step increases specificity as the pre-amplifier will only hybridize if the two targets are next to each other.
- The pre-amplifier also contains 20 binding sites for amplifier probes, with each amplifier probe themselves containing 20 binding sites for fluorescent-labeled probes. This increases the signal amplification over the background compared to single labelled probes.
- Imaging is conducted using commercially available fluorescent microscopes and does not require the purchase of specialized equipment.
- Currently multiplexes up to four target genes (limited by the number of spectrally discernible fluorescent dyes) however Akoya Biosciences, which has an established multiplexed IF platform (see below), recently announced a partnership to automate RNAScope assays, so watch this space.
MERFISH
- Multiplexed Error Robust ISH (MERFISH) was developed in 2015 to simultaneously image multiple RNA species in single cells, which is limited when using traditional smFISH methods due to spectral overlap 10.
- RNA targets are first hybridized with a sequence-specific oligonucleotide probe with unique flanking read out regions. Fluorescent probes are then hybridized to the readout probes, imaged, then extinguished in multiple sequential rounds. The combination of fluorescence signal from each round creates a binary code that indicates the identity and location of the mRNA target.
- MERFISH is compatible with fresh-frozen tissues or cells mounted on silanized glass coverslips, with the hybridization and imaging conducted on Vizgen’s MERSCOPE platform.
- This method is capable of showing subcellular RNA compartmentalization with high multiplexing capabilities (> 100 RNA targets).
GeoMx DSP
- The Nanostring GeoMx DSP system uses a tissue section mounted on a standard histology slide and can be used for investigating the distribution of RNA and proteins in samples 11.
- After appropriate sample preparation for frozen or fixed tissues, the sample is incubated with a cocktail containing both antibodies and mRNA ISH probes tagged with UV-cleavable oligonucleotides.
- The sample is first imaged for IF to visualize the morphology of the sample, and is used to define which areas will undergo further analysis, e.g. specific ROIs with a polygon, a particular label etc.
- The selected regions are illuminated with UV light to cleave the oligos which are removed and analyzed in a separate instrument (e.g. counting on Nanostring’s nCounter or next-generation sequencing via Illumina protocols). The resultant data are mapped back to the defined ROIs to reflect in-situ expression.
- As the process is non-destructive, the tissue sample can be reused for other rounds of analysis.
Visium Spatial Gene Expression
- Visium Spatial Gene Expression analysis from 10x Genomics is based on work first reported in 2016 8, and uses proprietary slides that contain capture areas containing 5,000 barcoded spots. Each spot is approximately 55 µm in diameter and captures transcripts from 1-10 cells. The slides are are single use only.
- Tissue sections are placed onto capture area, stained with H&E or IF, and imaged on microscope in tile mode to create overall tissue images.
- The sample is then permeabilized, the released mRNA is ex-situ synthesized to cDNA and sequenced. The results contain the spatial barcode from spot which links the transcript back to its original location.
- 10x software takes microscope slide image and sequencing data files and performs tasks such as alignment, tissue detection, determine clusters, and gene expression analysis.
The different methods of Spatial proteomics
While the presence of mRNA indicates that protein expression is highly likely, the transcriptome does not reflect things such as protein quantity, post-translational modifications, or protein interactions. Of course, one way to spatially analyze the presence of some of these things in tissues is via immunological reaction, thus a number of Spatial Proteomics techniques utilise antibody labelling but with more complex detection than via a microscope.
Multiplexing with IF and oligo-tagged antibodies
As mentioned previously, IF allows for multiplexing due the ability to differentiate labels by using fluorochromes that emit at different wavelengths on the visual spectrum. Commercially available fluorescent microscopes allow the routine investigation of four to nine different labels with different excitation wavelengths, but care should be taken regarding spectral overlap. The development of oligo-tagged antibodies allows for even greater multiplexing. The CODEX system from Akoya Biosciences (renamed the PhenoCycler in Jan 2022) uses proprietary oligo-tagged antibodies and then cycles of hybridization, fluorescent image acquisition, and removal to profile 50 different proteins per section as single-cell resolution 12,13. The CODEX technology is compatible for fresh frozen (FF) and paraffin embedded (FFPE) tissue sections from mouse and human. As previously mentioned, NanoString’s GeoMx DSP/nCounter system can also be used for multiplexed protein investigation due to the use of UV-cleavable oligo-tagged antibodies, and is capable of completing 90-plex protein assays for 12 samples in 3 days 14. However, unlike the CODEX which produces images from their labelling, DSP data is a profiling technology, not imaging, but the spot profiles can be spatially mapped back to the image that was previously used to define the ROIs.
Mass Cytometry Imaging with Imaging Mass Cytometry (IMC) and Multiplexed Ion Beam Imaging (MIBI)
Mass cytometry imaging combines IHC, flow cytometry and MSI for multiplexed proteomic analysis at a single cell resolution. For now there are two techniques using this principle: First described in 2014 15, IMC™ is commercially available from Fluidigm and evolved from laser ablation-inductively coupled plasma (LA-ICP)-MSI. In this technique, proteins are detected via metal-conjugated antibodies and ablating the tissue with a laser 16. The ion plume is then fed into a TOF mass spectrometer and the metal isotopes measured based on their m/z and position, as with standard MSI. Phenotyping information is provided linking the localization and concentration of metal ions with their conjugated antibody target. This technique currently allows multiplexed imaging of up to 40 different markers at approximately 1 μm spatial resolution and can be conducted using frozen and FFPE samples mounted on silane-coated glass slides.
Similarly, MIBI™ from IonPath was also first described in 2014 and involves incubation with metal-isotope labelled antibodies 17, but the difference lies in the ionization and detection method which is essentially TOF-SIMS18. An ion beam scans the tissue in a raster and ablates a thin layer of the surface, ionizing the antibody-bound metal isotopes. The secondary ions are then fed into a TOF mass spectrometer and the isotope abundance measured. MIBI has been demonstrated using FFPE tissues mounted on silane-gold-coated slides and a reported spatial resolution of 260 nm resolution 18.
Both IMC and MIBI have been used to investigate different tissues, tumors and the tumor microenvironment. For a comparison of the two techniques, please refer to this review 19.
…and don’t forget mass spectrometry imaging
Of course, there is always the possibility to spatially map proteins and peptides from tissues sections using mass spectrometry imaging, as outlined our previous blog entry. It is known that protein MSI is much less sensitive compared to other mass-spectrometry-based proteomics techniques due to the lack of a separation step, however MSI can be used as an initial screening tool to define tissue areas for deeper, more sensitive proteomic investigation with LC-MS 20. This workflow was recently demonstrated using a fresh-frozen breast cancer sample mounted on a PEN membrane slide, for laser microdissection, and mass spectrometry measurements on the dual source timsTOF flex 21. The sample was prepared and measured for lipid MALDI-MSI, with the sample stained with H&E and cancer regions annotated by a pathologist post-measurement. The MSI data underwent clustering to identify regions of interest within the tumor, which were then dissected out for proteomic LC-MS analysis. Using this workflow, the authors found confirmed areas of tumor heterogeneity based on the proteomic profiles of the areas identified by lipid MALDI imaging.
Conclusion
Given that cells and tissues don’t exist in isolation, it is important to know the spatial context of cell markers and transcripts. For this reason, these two blogs addressed histology and new spatial techniques. We covered cornerstone histological techniques – the importance of FFPE tissue, H&E staining, IHC and IF, and how these histology and microscopy techniques are used in novel Spatial Omics technologies.
If you are conducting different spatial analyses and have questions about data integration and analysis strategies, feel free to contact Aspect Analytics for a discussion.
References:
- Huang AM, Newton D, Kunapuli A, et al. Impact of rapid organism identification via matrix-assisted laser desorption/ionization time-of-flight combined with antimicrobial stewardship team intervention in adult patients with bacteremia and candidemia. Clin Infect Dis 2013;57:1237-45.
- Kriegsmann M, Casadonte R, Kriegsmann J, et al. Reliable Entity Subtyping in Non-small Cell Lung Cancer by Matrix-assisted Laser Desorption/Ionization Imaging Mass Spectrometry on Formalin-fixed Paraffin-embedded Tissue Specimens. Mol Cell Proteomics 2016;15:3081-9.
- Kriegsmann M, Zgorzelski C, Casadonte R, et al. Mass Spectrometry Imaging for Reliable and Fast Classification of Non-Small Cell Lung Cancer Subtypes. Cancers (Basel) 2020;12.
- Al-Rohil RN, Moore JL, Patterson NH, et al. Diagnosis of melanoma by imaging mass spectrometry: Development and validation of a melanoma prediction model. J Cutan Pathol 2021.
- Lazova R, Seeley EH, Keenan M, Gueorguieva R, Caprioli RM. Imaging mass spectrometry--a new and promising method to differentiate Spitz nevi from Spitzoid malignant melanomas. Am J Dermatopathol 2012;34:82-90.
- Mascini NE, Teunissen J, Noorlag R, Willems SM, Heeren RMA. Tumor classification with MALDI-MSI data of tissue microarrays: A case study. Methods 2018;151:21-7.
- Marx V. Method of the Year: spatially resolved transcriptomics. Nat Methods 2021;18:9-14.
- Stahl PL, Salmen F, Vickovic S, et al. Visualization and analysis of gene expression in tissue sections by spatial transcriptomics. Science 2016;353:78-82.
- Wang F, Flanagan J, Su N, Wang LC, et al. RNAscope: a novel in situ RNA analysis platform for formalin-fixed, paraffin-embedded tissues. J Mol Diagn. 2012 Jan;14:22-9.
- Chen KH, Boettiger AN, Moffitt JR, et al. Spatially resolved, highly multiplexed RNA profiling in single cells. Science 2015; 348, aaa6090.
- Merritt CR, Ong GT, Church SE, et al. Multiplex digital spatial profiling of proteins and RNA in fixed tissue. Nat Biotechnol 2020;38:586-99.
- Goltsev Y, Samusik N, Kennedy-Darling J, et al. Deep Profiling of Mouse Splenic Architecture with CODEX Multiplexed Imaging. Cell 2018;174:968-81 e15.
- Schurch CM, Bhate SS, Barlow GL, et al. Coordinated Cellular Neighborhoods Orchestrate Antitumoral Immunity at the Colorectal Cancer Invasive Front. Cell 2020;183:838.
- Wang N, Li X, Wang R, Ding Z. Spatial transcriptomics and proteomics technologies for deconvoluting the tumor microenvironment. Biotechnol J 2021;16:e2100041.
- Giesen C, Wang HA, Schapiro D, et al. Highly multiplexed imaging of tumor tissues with subcellular resolution by mass cytometry. Nat Methods 2014;11:417-22.
- Porta Siegel T, Hamm G, Bunch J, et al. Mass Spectrometry Imaging and Integration with Other Imaging Modalities for Greater Molecular Understanding of Biological Tissues. Mol Imaging Biol 2018;20:888-901.
- Angelo M, Bendall SC, Finck R, et al. Multiplexed ion beam imaging of human breast tumors. Nat Med 2014;20:436-42.
- Keren L, Bosse M, Thompson S, et al. MIBI-TOF: A multiplexed imaging platform relates cellular phenotypes and tissue structure. Sci Adv 2019;5:eaax5851.
- Baharlou H, Canete NP, Cunningham AL, Harman AN, Patrick E. Mass Cytometry Imaging for the Study of Human Diseases-Applications and Data Analysis Strategies. Front Immunol 2019;10:2657.
- Alberts D, Pottier C, Smargiasso N, et al. MALDI Imaging-Guided Microproteomic Analyses of Heterogeneous Breast Tumors-A Pilot Study. Proteomics Clin Appl 2018;12.
- Dewez F, Oejten J, Henkel C, et al. MS Imaging-Guided Microproteomics for Spatial Omics on a Single Instrument. Proteomics 2020;20:e1900369.